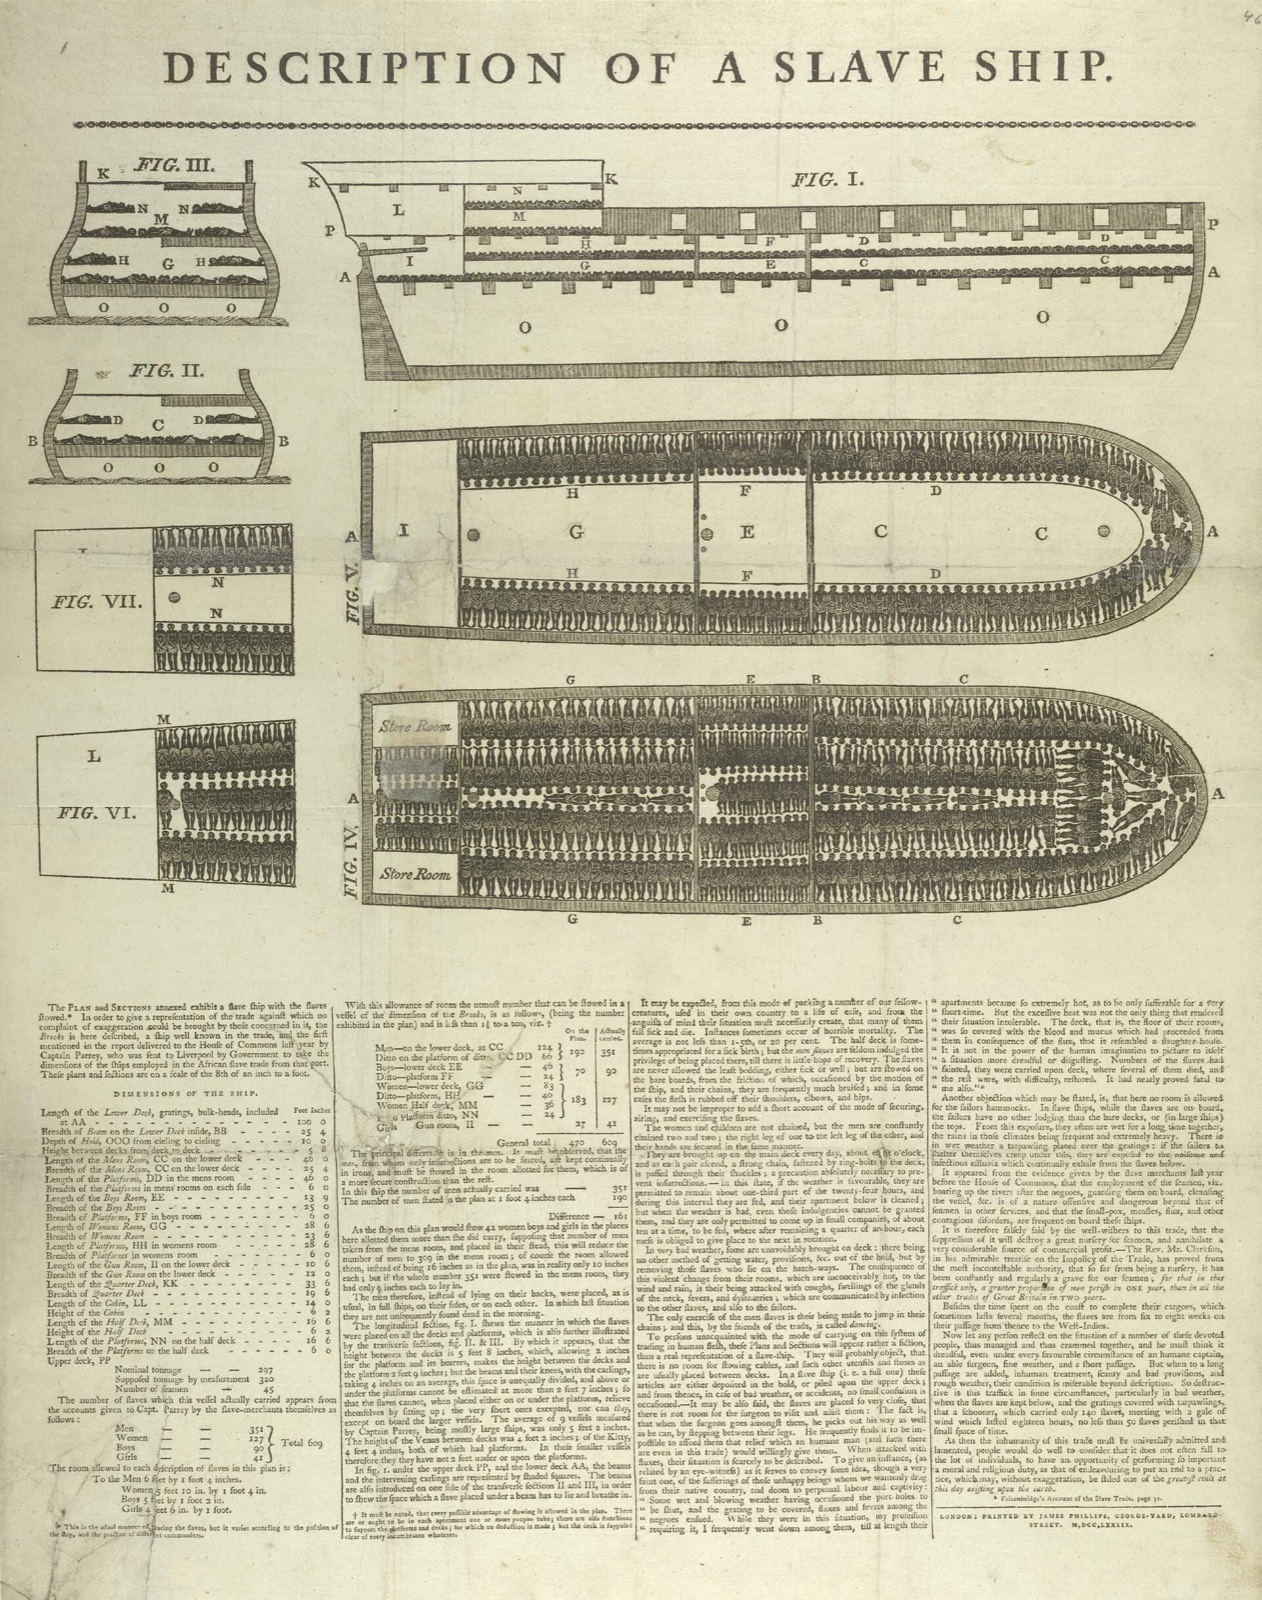
Diagram of the British slave ship Brookes, first published in 1788 by abolitionists. It is later than 1650. It is the clearest picture we have of how the trade packed a ship. Public domain, British Library.
The textbook draws three arrows. The ships were messier than that. The commodities were not. England, Africa, and the American colonies locked into one trade.
The textbook draws three arrows. The ships were messier than that. The commodities were not. England, Africa, and the American colonies locked into one trade.
Schoolbooks call it the triangular trade. A ship leaves England with guns, cloth, and metal. It trades those goods on the African coast for people. It carries the people to the Caribbean or to the Chesapeake. It carries sugar, tobacco, or rice home. Three stops. One profit.
The picture is too clean, and it is still the right picture to start with. Real voyages broke the triangle all the time. Some ships went out and back on one leg. New England merchants ran rum to Africa and molasses home from the French Caribbean, a route London hated. Portuguese and Dutch carriers were in the same ocean, often on better terms than the English story admits. Historians of the slave trade, working from the Trans-Atlantic Slave Trade Database, have spent decades taking the neat triangle apart. They are right about the routes. They have not abolished the fact of the goods.
What held the system together was not a single ship’s itinerary. It was a set of prices that needed each other. English manufacturers needed a market. African sellers, themselves often armed by European buyers, supplied captives. American plantations needed labor because the crops that paid — sugar above all, then tobacco and rice — used people up. Europe paid for the sweetness and the smoke, and lent the money that kept the next voyage moving.
Sugar was the center of the profit, not tobacco. A Barbados or Jamaica plantation in the late seventeenth century was a harder, richer machine than a Virginia farm. Virginia was attached to the same ocean. The leaf went to London. Credit and finished goods came back. Enslaved people came from the Caribbean as well as directly from Africa. The “triangle” on a poster hides that the American colonies also traded with each other. The poster does not invent the ocean.
The arrows are drawn between ports. The loss sits in the middle of the arrow from Africa to America. Death in the passage, death in the first year on a plantation, and a life priced as cargo: that is the cost the freight rate never prints as a cost. It prints it as a margin. Insurers, captains, and merchants had numbers for it. Families did not get a line on the account.
When WallPost says this trade built the commercial world the colonies lived in, that is not a compliment. It is a description of where the money came from. Later American finance, shipping, and insurance did not appear from nowhere in 1792. They grew up in ports that already knew how to price a hull, a cargo, and a person.
Sources · The Trans-Atlantic Slave Trade Database (slavevoyages.org) for the scale and the variety of routes; Eric Williams, Capitalism and Slavery (1944), as a classic argument, not as the last word; David Eltis and David Richardson, Atlas of the Transatlantic Slave Trade (2010). The Brookes diagram is a 1788 abolitionist document.